It's a bit confusing what he's arguing against. But his 2nd-last graph is the good one, [1]. That's only 20 years but [2] is the same thing since 1950.
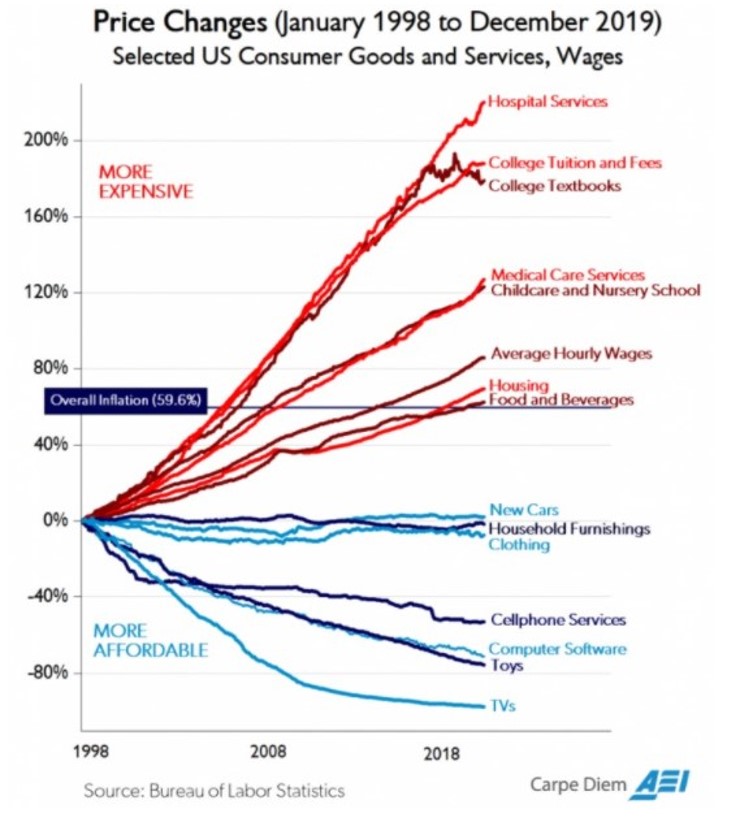
Some things have become much cheaper, other things have become more expensive. Attempting to summarize that in one number seems like it hides more than it exposes, no matter what number you pick.
I find it interesting to look at this graph against Maslow's hierarchy of needs.
First layer, shelter and food, have increased almost perfectly in line with wages. That's reasonable.
Second layer, security - including healthcare in the US - "feels like it’s experienced hyperinflation", according to the author. And, as you age, your healthcare needs increase.
So if you're low in this hierarchy, being relatively poor, then inflation might feel much more punishing to you.
As a poor person, you might have experienced inflation as averaging 6% over these 20 years, even if the underlying figure averages 2%.
You can also make almost the opposite point. We used to spend a lot on basic needs like food and shelter, 3/4 of the average income on food, and more money on bread alone than on housing (IIRC, 19thC rich countries). As growth/technology made these cheaper, or if you prefer, made us so rich that they can be had for a tiny fraction of our income, we spend it on other things.
Many of these are status competitions -- it's the location of your house that's expensive, not the drywall, and that's an auction against others who also want it. Education in these graphs is arguably like that too -- what's expensive is a top name, rare connections; the actual knowledge is very close to free.
Healthcare isn't a status competition. But it does increasingly seem like it's possible to spend an unlimited amount of money on it -- why not try a million-dollar cancer treatment if you can (somehow) afford it? None existed in Maslow's time partly because the science hadn't advanced, but also because there were too few potential customers. As a society, it isn't crazy to think that this should be a growing proportion of what we buy. If you think it should be a decreasing slice of the pie, then what exactly should be increasing, over the next 50 years? (Although obviously I'm aware of the ways in which how we buy it is deeply broken.)
According to [1], the average cost of education has risen significantly faster than the CPI, not only the cost of top name universities with rare connections.
> [Since 2001], in-state tuition and fees at public National Universities have grown the most, increasing 212%.
while
> The total consumer price index inflation increased by around 50% from August 2000 to August 2020, according to the U.S. Bureau of Labor Statistics.
I guess I do think people paying for education are trying to buy something other than knowledge, even when it's not the ivy league. Perhaps more like trying to buy a position in society, an entry to a respectable white-collar career.
That would be why (in this theory of mine) it hasn't been disrupted by technology. The ability to impart knowledge to lots of people, in a way which was once only possible by gathering them in a room with a teacher, has indeed become cheap. But, as you say, this has not placed pressure on college tuition, as would happen in a more normal industry, which was actually selling what it says it's selling.
> Second layer, security - including healthcare in the US - "feels like it’s experienced hyperinflation", according to the author.
Not just the US. From 2000 to 2018, US healthcare costs went up by a factor of 2.3. Germany went up by 2.1, France 1.8, Canada 2.0, Italy 1.7, Japan 2.6, and UK 2.6. It's similar for most other OECD countries, and also similar if you expand the range to 1970-2018. My data source doesn't go back farther than 1970.
Here's a comment from a while back with a source for those numbers [1].
The US has two problems with health care costs. (1) we pay a lot more than nearly anyone else per capita, and (2) the cost is going up in an unsustainable manner.
The first problem is mostly just a US problem, but the second is a problem for everyone. This suggests that the first problem is due to something the US is doing wrong and could fix. The second problem, though, seems to be one that nobody has figured out.
In 2009 the price of a colchicine prescription went from $ 4.00 a month to $ 360.00 a month. But I don't think it registered in the inflation statistics.
(The last time I got some it was handled by my mandatory obamacare insurance... which means it cost the insurance company 240 and me a 160.00 copay. Yay high deductables.)
The thing he's arguing against is the Chicago/Austrian school of economics, whose response to just about every monetary policy measure is "But inflation!" UBI would cause inflation; raising the minimum wage would cause inflation; worker protections would cause inflation; government borrowing causes inflation.
That kind of economics gained popularity in the 1970s, when inflation caused genuine hardship. It left a kind of economic PTSD -- especially among people who have money, because inflation erodes the value of savings. The response is a trickle-down economics, where the best way to help the poor is to ensure that the rich have lots of money so that they can give poor people jobs.
So the Internet is full of "But inflation!" and often "But hyperinflation!", usually based on an argument from the first two weeks of economics class where you're shown supply and demand curves. But economics classes go past two weeks. There's a lot more to it than that, and the data simply don't support that argument. The fact is that consumer inflation is very low, and has been for a long time, despite intensive intervention from the central banks.
It is more complicated, and there has been inflation -- most notably in the stock market, and to a lesser degree in other assets (including real estate and cryptocurrency). The stock market has inflated to ludicrous levels, not just in tech assets but as a whole. But not at the consumer level, for a variety of reasons -- a lot of things have become cheaper to produce, and despite tax cuts for the wealthy wages haven't gone up. The wealthy don't eat more or live in more houses with that money, so they're not competing all that much for regular consumer goods. They take all that extra money and buy stocks -- trading them to each other rather than actually starting new businesses.
Anyway, that's what he's arguing against. It should shortcut a whole line of knee-jerk "but inflation!" arguments. But it's been true for decades, and this isn't a new observation, so it doesn't really change anything.
> especially among people who have money, because inflation erodes the value of savings.
What? Wealthy people don't buy CDs. They tend to invest heavily in assets. Often, these are leveraged assets like real estate or equities in a margin account.
NOTHING makes the rich richer like inflation. Reducing the burden of low-interest mortgage or margin debt whilst boosting earnings in equities.
Meanwhile, the poor still pay 20%+ on credit cards used to buy food that gets more expensive every year, and see annual rent increases from their landlord.
There's a reason that CNBC cheerleaders absolutely love ZIRP, and it's not because it helps the downtrodden poor.
My interpretation of the comment you're replying to is that "people with money" doesn't refer to the wealthy - who, as you point out, are typically asset-rich - but instead of a cash-rich, asset-poor middle class (or even anyone in the working class with some savings).
Certainly if you're currently saving up to buy your first house in large parts of the West, inflation is your bogeyman - it threatens to simultaneously drive up house prices further and devalue your deposit.
This argument mostly comes from the upper-middle-class types who make Friedmanesque arguments on the Internet, who seem to focus on their eventual retirement moved into low-interest assets like bonds. They want to make the big risky investments, then stop the whole economic engine once they're safe.
Actual Chicago economics arguments are much better than the ones you hear on the Internet. I think they're still pretty bad, but not as bad as the parodies based on first-half-of-the-first-semester Econ 101. HN in particular is often full of that kind of argument, because it attracts a demographic of exactly that top 20% who have lots of assets but enough in cash-equivalents -- or imagine they will some day real soon.
I'm referring to the long term policy of tax cuts, starting in the 1980s. The data set you link to has real median income (after inflation) going up by about 40% since 1975, under 1% per year.
That's not zero, but compared to GDP, the stock market, and other measures of overall economic health -- which have gone up by an order of magnitude or more -- the median is practically immobile.
And for much of that time, it was even more immobile. The median was $31k in 1997, and was $31k in 2014. It bottomed out at $30k in 2012; it has been rising since but that was almost two decades of complete stagnation -- while GDP rose and stock markets climbed.
Your choice of a thirty-two year period, and 11 year period, and a 24 year period, when the unequal periods aren't supported by some kind of consistent in-period patterns in the conjectured independent variable, plus using fuzzy subjective descriptors for the independent variable, suggest a breathtaking degree of cherry picking and desired-results-driving-methodology, here.
They are unequal periods, and that's why we annualize the growth.
The periods aren't "cherry-picked." If you'd actually look at the plotted effective capital gains rate, you'd see a clear difference in tax policy in those three periods.
The "fuzzy subjective descriptors" are totally in line with the parent poster's: "long term tax policy."
> The periods aren't "cherry-picked." If you'd actually look at the plotted effective capital gains rate, you'd see a clear difference in tax policy in those three periods.
The first period includes within it a perfectly flat period longer than shortest of the periods you chose followed by a period of equal length that is more consistently increasing than the (mostly flat) period you've held up as an increasing trend, and then a period nearly as long as your shortest that is as consistently and more sharply decreasing than the one you hold up as showing a decreasing trend.
So, no, I don't see natural breakpoints in the data.
(You've kind of muddied whether you are more concerned with the actual cap gains tax rate or the trend in changes to the rate, seeming to lean a little more heavily on the former, so I focussed on that in my criticism; but if you care about the rates instead of the deltas the periods you chose still make no sense, for similar reasons.)
> The first period includes within it a perfectly flat period longer than shortest of the periods you chose followed by a period of equal length that is more consistently increasing than the (mostly flat) period you've held up as an increasing trend, and then a period nearly as long as your shortest that is as consistently and more sharply decreasing than the one you hold up as showing a decreasing trend.
It sounds like you're referring to the "maximum tax rate on long term gains." As I stated, I used the "effective capital gains tax rate," which is the average rate that is being taxed (long term cap gains tax is different than short term).
The final graph on median home mortgage payments is misleading too. That can be propped up by REITs and increasing institutional ownership of consumer homes.
There’s also the issue of more millennials living with parents and relatives, unable to afford their own homes, which can be hidden in that.
Definitely can’t conclude from it that wages and purchasing power have kept up with mortgage costs.
Millennials can live at home because average home size has increased. My first house, built in the late 19th/early 20th century had indoor plumbing retrofitted and would fit in the garage of my current house.
Even if that was purely true, that doesn’t say anything about relative purchasing power to afford mortgage costs though. Home sizes increasing doesn’t mean home prices, relative to purchasing power and technology changes, have stayed consistent with real wages.
And it’s likely not purely true. Home sizes being larger is also a function of REITs and corporate ownership of more consumer real estate, as well as boomers using soaring retirement fund profits to finance remodels, etc.
It’s way more complex than to draw any conclusion that this means purchasing power of homes has stayed close to wages. It hasn’t.
> Unfortunately, the pandemic has permanently broken every economic chart in existence.
> But if we take away the outlier 2020 data points, the average real annual GDP growth from 2010-2019 was 2.3%. The inflation rate in that time averaged roughly 1.8% per year.
> If you’re one of the conspiracy people who believe inflation has actually been running at 5-6% per year, that would assume the economy has been contracting by 1-3% per year over the past 10 years.
> And if you’re a full tinfoil hat person who assumes inflation is actually 10-12% per year[fn2], that’s like saying we’ve been in a full-blown depression and the economy has lost 80% of its value.
> This is absurd and patently false but that’s the claim you’re making if you really think inflation is this high.
His connection to reality seems to be tenuous in some aspects:
> In June 2018, Butowsky filed a defamation lawsuit in U.S. federal court seeking $57 million in damages from NPR and one of its reporters, David Folkenflik. Butowsky accused Folkenflik of pushing a "false narrative" of Butowsky's involvement in a now-retracted Fox News story alleging that the murder of Democratic National Committee staffer Seth Rich was connected to the 2016 leak of DNC emails to WikiLeaks. Butowsky also alleged that Folkenflik conspired with an attorney to extort money from Fox. Butowsky told Courthouse News Service that he still believes the Fox News story was accurate.[12] The case is scheduled to go to trial in mid-2021.[13]
> By August 2020, Butowsky still insisted that the retracted Fox News story was accurate.[2] He claimed without evidence that the Seth Rich family were "not innocent bystanders" and that they were "in possession of material evidence indicating that Seth Rich downloaded the DNC emails, sent them to Wikileaks, and requested payment."[2]
So if the GDP grew "only" ~2.5%, then any inflation above that (as the 'truthers' claim), would mean were actually in a recession/depression for the last decade... which makes no sense. If inflation is >5% (per the truthers), then the economic growth would have had to been on top of that, for a nominal growth rate of >7%.
These lines cluster in interesting ways. Is this a mere coincidence? Is this a weird selection bias in how the graph was created? Is this an actual correlation in where these prices come from?
One gotcha about how inflation is calculated (at least in Germany, I assume it to be the same in the US), is that they try to compare identical products. So if this years cars do not have air conditioning, but next years cars do, the prices can increase accordingly without showing up as inflation, because you are getting "more car for more money". The problem appears at the point, when there are no cars without air conditioning anymore: You actually have to pay more to get a car, while your inflation statistics still say, prices have not risen.
This is a fundamental problem with inflation calculation. How much would an iPhone be worth in the 1800's? How much would the Federal government have paid for a gigabit internet connection 100 years ago? Considering they spent tens of millions of dollars developing the Arpanet, I would say that the cost of internet has fallen dramatically.
Inflation calculations are only meaningful over short time periods. When chained over decades and centuries, we may as well be comparing two foreign currencies and societies.
AIUI, economists measure inflation by comparing prices of a "basket of goods" – the contents of which change over time, specifically to reflect changes in consumer habits, technological progress, and other non-monetary factors. If we can trust or agree that the basket is updated frequently enough with sufficient accuracy at a broad scope, then inflation should indeed be comparable over decades.
This is the same in the US, yes. And it's still the correct thing to do.
Inflation can't be a measure of every dimension of economic hardship at once. As the article points out, healthcare has risen in cost dramatically more than most other things. Does that mean that somehow the inflation rate must reflect the pains of those households not in the average and aggregate?
Less capable goods may no longer be available. You can no longer purchase a Model T, and must purchase a car that's faster, safer, more comfortable, and more reliable. Even if you don't particularly value that, your car objectively is faster, safer, more comfortable, and more reliable. The inflation rate can't change because your preferences are for a cheaper, but inferior good.
The problem then is that "inflation" should not be used to argue that a large block of people aren't getting the shaft. That seems to be the most common exercise in citing inflation.
I once read an article that claimed official statistics radically over-estimated how healthy US manufacturing was - because the official statistics considered a factory making CPUs with 16MB cache to have 1000x the output of a factory making CPUs with 16kB cache.
Is the author debating a strawman or something? Actually, they just seem confused. At the start, they state asset price increase is not inflation, then, at the end, agree that there is some inflation going on in the real estate space.
So the author is agreeing with the people they're supposedly countering. I don't understand the point of this piece.
Yes, the author is debating a straw man. The argument that the government is understating inflation is a pretty simple one.
1) The government is heavily incentivized to understate inflation in order to limit its expenditures for social security and TIPS, both of which are indexed to inflation. Social security in particular would explode in costs if, say, the official rate had been 1% higher on average over the past 30 years since the inflation measure got significantly changed during the late 80s and early 90s. In fact, if you look back at the discussion surrounding those changes, bringing down the costs of social security was an explicit reason for the redesign.
2) Complexity and obscurity. None of the input data is released, and there's this thing called 'hedonic quality adjustments' which is the umbrella beneath which economists decide how much to lower inflation when the quality of goods gets a little bit better. The FED economists point out that a car from 2018 is better than a car from 2012 and they adjust inflation downwards in order to account for the increase in value that consumers are getting in their car. Consumers counter by pointing out that they still have to spend the actual money...
Analysis) With transparency and a lack of incentive to cheat (see 1) hedonic quality adjustments would be an allowable modification, but with opacity and a strong incentive to cheat, they pretty much guarantee that inflation is fudged downwards. The debates around changing the inflation measure have focused heavily on reducing social security payments. In short, any time you have excessive complexity, lack of transparency, and an incentive to cheat, you can expect cheating.
Why should we care? First and foremost, Anyone who has a relative collecting social security would probably be upset to hear that grandma is getting about 60% of what she should be getting, given the promises made and the value of the money she contributed.
Second, and the big point that the article missed entirely, is that real gdp per capita HAS been declining, reflecting that decrease in standard of living that one would expect to see if inflation were understated.
> Unfortunately, the pandemic has permanently broken every economic chart in existence.
> But if we take away the outlier 2020 data points, the average real annual GDP growth from 2010-2019 was 2.3%. The inflation rate in that time averaged roughly 1.8% per year.
> If you’re one of the conspiracy people who believe inflation has actually been running at 5-6% per year, that would assume the economy has been contracting by 1-3% per year over the past 10 years.
> And if you’re a full tinfoil hat person who assumes inflation is actually 10-12% per year[fn2], that’s like saying we’ve been in a full-blown depression and the economy has lost 80% of its value.
> This is absurd and patently false but that’s the claim you’re making if you really think inflation is this high.
If GDP was growth for the last decade was "only" ~2.5%, then how could have inflation been higher than that? It would have meant we were in a recession/depression.
Yeah, and the claim that inflation has been at 10-12% per year for the past 5 years is so ridiculous that it can be discarded without any analysis.
If they claimed that inflation is, say, 3.5% instead of ~2% then we could look at their arguments. But to claim that it's at ~10-12% is a little like claiming that all our thermometers are faulty and it's actually 40 degrees Celsius outside. Complete detachment from reality.
>Second, and the big point that the article missed entirely, is that real gdp per capita HAS been declining, reflecting that decrease in standard of living that one would expect to see if inflation were understated.
And why resort to conspiracy theories? Look at other data sources. They are consistent with the official inflation rate. E.g. https://fred.stlouisfed.org/series/T10YIE or MIT Billion Prices Project.
If that's your only explicit criticism, then that's not much of a criticism.
The author was clearly referring to stocks, bonds, and other financial instruments when discussing asset price inflation (he refers specifically to "risk assets"). And then, at the end, he didn't "agree" that there is some inflation in the real estate space:
> Of course, there are areas of the country where housing prices are out of control. But this is how averages work. Some data points are above average while others are below average.
In any case, I don't believe that he's arguing against a strawman. I've seen plenty of discussions on HN alone that the "true" inflation is much higher than the reported inflation, and that this can only be measured by looking at BitCoin prices, for instance.
I'm saddened to see that while this post isn't down-voted, it is not the most up-voted post that it deserves to be so. I expect this to be because most people don't know what the Cantillion Effect is, so this post will attempt to show it.
People think of inflation like they think of the oceans. If the ice caps melt and water melts in, the shore lines from New York to Tokyo rise slightly. If you track this rise, that's inflation. That's not how it works, and it's not what the CPI tracks. Inflation is much more analogous to inland water, you know, lakes and rivers.
If you give the bottom 80% of the income distribution more money, they will spend it right away like a river. If you give the 81-90%, portion of it will be saved in their lake(say, a 401k) and they will spend some of it. And if you give the top 10% more money, they save all of it in their reservoir.
The way that we have been introducing new money into the system is not by melting ice in the middle of the ocean. We also haven't been raining all over. The key way that new money has been introduced over the past 50 years is by lowering the interest rate. When you lower the interest rate, what happens is that people refinance, and suddenly they can pay less, but quickly realize, oh, I can also borrow more, so they do.
I'll show you a few numbers, which I got by going to the zillow housing affordability page with default settings. I only modified the interest rate, all other values stay the same.
Year | Average Interest Rate 30 Year Fixed | Home you can Afford
1981 | 18.39 | $124,797
1991 | 9.00 | $200,862
2010 | 6.26 | $244,531
2020 | 2.67 | $328,569
And so what we see people and REITs and companies doing is taking out larger and larger loans, and putting those dollars into assets. Companies take out a bond and buy back their own stock(which props up zombie companies). And why wouldn't they, it's profitable because the environment makes it so. And that money flows throughout the system. We can track the inflow of all of this money by looking at say.. the M3. This seems to be the crux of your point, if the amount of money in the M3 has gone up by 40x since 1971, why is inflation not out of control?
The CPI is a measure for inflation that does not track the oceans water level. The M3 tracks that, and as you can see the M3 is out of control. The CPI doesn't track stock purchases, even though if you ask any personal finance person, they recommend that the average person put 15% of the money into retirement stocks, why is that? If the CPI were to track stocks weighted at 1971 levels, inflation WOULD be out of control. The CPI tracks, specifically, an average of tangible items that the bottom 80% spends their money on. Therefore the inflation number is based on the height of certain rivers. Now that's an important figure to keep in mind, after all if you get inflation in that bracket and income isn't rising, you quickly run into a revolution. And so that's what the FED has found, if you track the CPI you get the perfect amount of heating to boil the frog without them noticing.
But when you introduce money into the system by lowering interest rates, you are in effect giving the money in proportion to the assets already owned. Someone bought that home in 1981, and someone with the same exact income would bid 328k for it today. You basically tripled that home owners asset, without any need to compare anything else, like actual income rises, or for instance SF has moved upmarket which would also effect prices. And so if you don't have much assets, it's a desert. If you do, it's a rain forest. And because the wealthy already have all that they want, demand for those items that the bottom 80% spend their money on doesn't change. So the supply and demand of those items don't change. So the CPI value stays the same. But money was introduced. If you take a look at the velocity of the M3, the M3V, you can see this take place. The wealthy get the gains of the new M3 dollars, and store it away. The more dollars created, the lower the velocity.
So the question we have to ask ourselves, now that interest rates are at 0%, is that the FED has two options, they can continue to do they have been doing this year and dump the money straight into the reservoir by buying bonds and we'll get the same results, but it doesn't look like that is going to have popular support much longer. You see lowering interest rates is an implicit way to give wealth to the wealthy, and much like how CO-VID is implicitly killing more people per day than 9/11 did explicitly, but now that the FED is forced to explicitly give money out. What happens if it starts raining in the desert by printing money and handing it out fairly, say through a UBI? Will the rivers rise? If the CPI inflation indicator shows that the rivers are rising, what are we set to do?
I found the “Price Changes” graph about 2/3 down the page really alarming.
Virtually all of the gains in the form of lowered prices are purely in discretionary consumption and subsistence goods. Cheap entertainment, toys, staple foods.
Meanwhile the insane price increases are in critical needs, medical care, housing, college education.
In my mind that graph is pretty strong evidence that there really is massive inflation and the idea of “asset inflation” does exist, contrary to the author’s lead point that it should be seen as normal growth of value.
For most people, if you show them this data and said, “see, low inflation, don’t worry...” they are rightfully going to be pissed off. “Low inflation” except in everything that really matters for health, home ownership and betterment for my children.
I guess I should just thank the monetary policy overlords for my cheap Netflix while we all die of cancer under the thumb of landlords and all our economic participation from labor dwindles and continues to lose purchasing power for what we most need.
This is just it ; The author doesn't compare to CPI as calculated using the methodologies for the 1990s or the 1980s - he just builds a straw man and throws cheap consumer electronics at it. What he fails to realize, is that this is precisely the argument of those who believe real inflation to be higher than reported; Namely, that without including cheap electronics and luxury items the picture is much much worse - which it is. This article built a nice strawman and burnt it - what I'd like to see is the author actually tackle the claims of his opponents rather than gross mischaracterizations of them.
This was a point I made when the pandemic shortages kicked off. The entire world's purchasing habits shifted towards guns, food, prepping gear, and TP. The prices of those items skyrocketed (when they could be found). I predicted at the time that, even though everyone was experiencing massive price inflation in the stuff we were actually buying, largely due to increased demand, it was not going to show up in the numbers because of the way inflation is calculated.
Put another way, if I'm in the market for housing, healthcare, groceries and gardening supplies, and the prices of all those things around skyrocketing, then it doesn't matter much to me if the price of cars is down 20% since the crisis began. The inflation measures, however, don't account for the shifts in purchasing demand, which should weight the measure heavily.
This is true. There's another even more interesting question related to the effects lockdowns etc had on the economy I think. How do you even measure inflation with your old basket when some of it becomes unavailable anywhere (some services) and for other parts half of the venues where they were sold (non essential retail outlets) are now shut?
My conclusion is that statistics about what happened to the economy during 2020 (ie the month to month path) are likely to be very unreliable. This might have implications for policymaking in future which I don't think have really been explored anywhere.
The price elasticity of higher education is 0, and healthcare is also very low. We see my more inflation in things that we're not willing to go without.
Isn't this entire article missing the difference between a luxury item and an essential item? A smartphone 10 years ago was a luxury for just about everyone who owned one (that is, bought with extra money) now it's a requirement.
The luxury purchase folks are certainly getting a better deal as apples:apples prices go down; but if you're paycheck to paycheck and used to be able to not buy a smartphone but now have to - you're just running on tighter margins.
I would imagine measuring economic well being directly through something like a "economic desperation index" makes more sense than doing a bunch of calculus on comparing the price and quality of items in two different years since the latter would only apply to people who own the item in both domains. Especially in the context of this article which is discussing if people have it better now or then.
Essential? Really? Many of us leave our phones off, leave them at home or in the car, and are only marginally impacted. The difference between 'any phone' and a smart phone is quite small. Except for folks addicted to them, who can't last a day without constant updates.
It's more essential the poorer you are. Because what's truly essential is Web access - for communicating with your friends and family, for access to government services and banking, and bunch of other little things you may need to do to secure a job, etc. Most of these things you can do even better on a computer - if you own one. A smartphone is the cheapest personal device with full-featured Web access these days, which is how it becomes essential for people who can't afford a computer (and a place to keep it, i.e. a home).
Ok I overstated it, I admit. In fact, my acquaintance who panhandles downtown has a phone and a tablet which he uses to keep connected, check weather (critical to him!), look up fitness routines etc. Especially now that the library is closed, it's a lifeline for him.
Many people don't have a computer. Their smart phone is also their computer.
There's myriad services in modern western life which require a computer of some sort to access. Increasingly government services, banks, transport, event ticketing etc are operating in an online-first way. How do you access those services without a computer?
I think you are seriously underestimating the number of essential services which are now mostly been conducted online. Try finding a property to live in or a new job without using the internet.
For many people their smartphone is their only access to internet (and thus bills, emails, and everything else that is more or less essential). The difference between the group of people buying an iphone because they need access to that stuff and the group of people where an iphone is only a distraction machine is a pretty solid proxy for the two groups I'm talking about between those who buy as a luxury vs essential purchase.
As much as people like to dump on smart phones; yes, they really are essential. My having access to news, music, books, podcasts in the palm of my hand is revolutionary. Literally any curiosity about any subject can be indulged at a whim. Social media might be toxic if you let it take over your time, but the benefits to society cannot be overstated.
Or folks who have only phone as their connection for voice and data. Not everyone has a car or home to leave it in and has to keep the phone on for their next gig.
The problem with measuring inflation is that you can cherry-pick the goods in your basket to paint the picture that you want to see. If I make a basket full of housing, healthcare, college education, and fresh produce, I can show you that inflation is out of control.
If you look at the "price changes" chart, prices for the red line items have gone up 4-6% per year over 20 years. While it's nice that you can buy a 55" flatscreen for the price of a 15" crt from 1998, TVs (and cars, furniture, clothing) are occasional purchases and can be cost-controlled by choosing cheaper options. Unlike healthcare/insurance, where you're stuck with paying for what you can get.
I'm not saying the article is wrong in general, but I don't get this last bit:
> The government isn’t suppressing the “actual” inflation number. And if they were, they would also be suppressing reported economic growth...
Surely by suppressing inflation they are increasing reported economic growth.
If the dollar value of the economy increases 10% with no inflation, then that's 10% growth, but if inflation was also 10%, then that's 0% real growth. So if the economy grows at the same dollar rate, but you manipulate the inflation number lower, you get more apparent real growth.
I think his point is that the same source numbers are used to calculate both inflation and GDP. If you suppress inflation by undervaluing goods and services you also suppress GDP. You could get away with divergence if your didn't provide your data, but at least in the US, you can see all the input data.
Isn't the federal reserve intentionally propping up markets? I thought in one of the reports they argued that there was higher inflation but it was restricted to certain markets like housing and so over all inflation was ~2%.
Not sure it's a case of intentionally propping up equity markets (of course interest rate policy directly impacts on government bond markets although I don't think that would normally be described as propping them up). But the phenomenon has been around for a while - I've heard it called "biflation" - high inflation in some markets/products (asset markets in general, as well as some services), alongside deflation in others like imported goods with not many goods/services actually following the middle road which the official inflation statistics give as an average. It's exaggerated to some extent but it's definitely there.
Others have claimed that the author buried the lede by placing the chart which shows runaway healthcare (hospital and medical care services) inflation at the end of the article.
However, there are sound arguments for why healthcare costs have not actually inflated much. Essentially, the argument goes, you're not buying the same thing that was available in the past. It's an apples to oranges comparison.
There are many problems with mainstream ideas about inflation, but one key problem is that it does not take into account the disastrous decline in the quality of public services that Americans have experienced over the last couple of decades. How do you measure the inflationary impact of the fact that in many cities, the public schools have declined in quality so much that people are faced with the choice of either moving to the suburbs, or paying for private school? What about the impact of the transformation of the built landscape from nice walkable towns to disgusting exurban sprawl?
Not sure why the downvotes, it’s just a fact. You may think we should spend more, or differently, but it’s a fact that the US has never spent more on public education in tan it has the last decade and its not even close.
He's also ignoring how the substitution effect, which normally serves to tamp down realized inflation as folks change the composition of the basket of goods and services they consume, is not applicable or less applicable to most of the red lines (food, housing, medical care).
On a long enough timeline if food and housing prices keep outpacing other prices, the proportion of consumer money devoted to such items will trend towards 100%. And if the basket is 100% stuff that keeps quickly going up in price, then CPI is also quickly going up in price (ipso fact).
The big difference people need to understand is between "core" inflation, and consumer price index, and whether that index includes super volatile items like food and fuel, and how they are weighted. It's one of those torturing data until it gives you the policy you want exercises.
You can make inflation say whatever you want it to say with selected goods and index weighting, so I don't get into arguments about it because it's mainly an obfuscation proxy for ideological conflicts.
> That emissions chart looked good. Half as much as 1970. Too bad we have 5 times as many vehicles
Yes, which is a problem environmentally, but from a basket-of-goods measure for the individual consumer, the number of cars is irrelevant: we as buyers are getting a better product.
Population has approximately doubled while simultaneously huge swaths of the globe have gone from "only the rich can afford cars" to "the middle class can afford cars."
While the CO2 certainly isn't good one would need to do some Olympic level mental gymnastics to argue that an increase in wealth to the point where billions more people can afford an expensive complex good like a car is a bad thing overall.
Also, all those changes were wrought by government fiat, and have been accomplished almost completely by reducing the weight of the cars, not by quality improvements as the article implies.
>have been accomplished almost completely by reducing the weight of the cars
This is entirely false. All the work in materials to make cars lighter has been countered by added amenities (from power seats all the way to chilled cupholders), additional safety measures (extra airbags), and (in the U.S. at least) shifting preferences toward trucks and SUVs.
From the first google result on the subject, slate: "The average new car weighed 3,221 pounds in 1987 but 4,009 pounds in 2010."
Much of efficiency gains are coming from improved engines which have better control of the combustion process to make sure fuel burns more completely and less energy is wasted, or in other words, engines are better quality.
Also: the items in the category with decreasing prices are almost all automatically mass-producable and will have the advantage of learning (i.e. increased production efficiency and decreased cost with increasing number of items produced) while the ones in the other category aren’t necessarily. Childcare/nursery isn’t going to become cheaper just because you’ve more experience with the job.
College textbooks really stand out though. These should not have to become more expensive. They are written once and printed cheaply thereafter. I wonder what the curve for other types of books looks like but my guess is that other books have not seen these increases and this is purely money-making.
I'm not sure that college textbooks are written once. It depends on the subject, but they are often replaced frequently e.g. as technology or laws are updated, and each one makes only a small number of sales. Yes, printing costs are relatively low, but they are also a relatively small part of the cost of many kinds of book.
Ask Japan. Their M1/2 has growth bigly over the last few decades and they've had next no inflation. Remember, the 'general' equation is: Inflation = Money_supply x Velocity.
Yes, there's a big tank of money sitting around, but it's not sloshing around the economy that much. And if it does start, there's at least one tool to cool things down: raise interest rates.
I think the author is confused about what inflation is, vs the benefits reaped from the advancement of technology. The author also seems to have a bias against the people screaming "inflation". That is pretty obvious from the title. To show real inflation, I like using the Burger King whopper as an example. In the early 90's I remember being able to buy 4 whoppers for $1. With the advancement of farming technology, transportation technology, preservation technology, etc.... Why do we see the whopper cost over $7 now?
So that's a 4.3x change, not a 28x change as claimed, and represents an "inflation" of about 7.5%/yr over the past two decades (or 5.5%/yr since 1990).
> In the early 90's I remember being able to buy 4 whoppers for $1.
The simple answer is that your memory is wrong, and that at no point in the 1990's were you able to buy 4 Burger King Whoppers for $1. Other than your recollection, do you have any evidence that this price is correct? Or have I missed a layer of hyperbole in your argument?
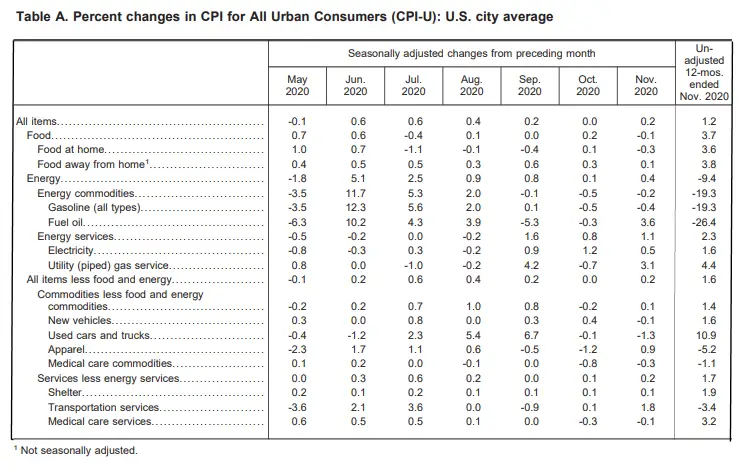
On one hand, he's not wrong, overall inflation for 2020 was on par for a normal year, we're not headed into hyperinflation territory just yet. But you also have to realize that some people are affected quite a bit harder by the crazy shifts in deflated and inflated costs this year.
Look at the breakdown of the line items that make up the US inflation rate for 2020 and you see that the massive drop in fuel cost (-19%) caused a massive offset to the overall number. Meanwhile food cost has gone up over 3%, medical expenses also went up over 3%. As we head out of this hell hole it will be interesting to see if inflated sectors return to more normal levels again.
There probably aren't publicly-available studies on the subject, but, in general it is true.
1. Material science has improved dramatically, even since the 90s. We now have oils that don't break down for years, even under extreme temperatures, and tolerances within engines are tight enough that oil can go 10,000 miles without meaninful gasoline contamination. Also, rust-proofing, rubbers, and plastics (!) are much, much better.
2. Solid state electronics have replaced mechanical systems. This is a big one: vacuum lines were a nightmare, carburetors were fickle, distributors wore out, etc. All of these systems have been replaced by maintenance-free electronic versions.
3. Better computer-aid modeling. This is kind of a good and bad, since now components aren't overbuilt like in the 90s, but they are also less likely to be underbuilt.
There are absolutely manufactures who still make unreliable heaps, but generally, reliability has improved. Most of that reliability comes in the form of less maintenance: no car needs the valves adjusted every 30k miles anymore (except maaaybe exotics).
Jay Leno likes to joke about how cars used to come with 90 day warranties in the 70s. 90 days!
Based on recent sales, our house has been appraised in the low $700,000 range for the last few years. We just put it up for sale and received three offers. $1,025,000, $1,030,000, and $1,050,000.
> You used to pay $14.99 for a single CD that may have had 2-3 songs at most that you enjoyed. Now you can pay $14.99 a month for literally all the music in history.
Strong language, name calling, no real argument. The conse sus is that inflation is not here now because of low money velocity but wil come next years inevitably.
> to beat inflation and keep up with or improve your standard of living.
He's being a big of a dullard here in that he's ignoring how inflation (or the expectation of inflation) can affect interest rates and how that can clobber asset prices.
Isn't GDP also kind of subject to inflation, as it measures monetary value of things? If so, saying "it's OK, because GDP grew at the same rate" doesn't make much sense.
Some things have become much cheaper, other things have become more expensive. Attempting to summarize that in one number seems like it hides more than it exposes, no matter what number you pick.
[1] https://awealthofcommonsense.com/wp-content/uploads/2021/01/...
[2] https://marginalrevolution.com/marginalrevolution/2019/05/wh...